
ENERGY MARKETS THE RECENT BOOM AND BUST
By: Karen Fireman, CFA – Fireman & Associates, LLC
10/3/2016
When The National Science Foundation’s Energy Program entitled Foundations of Resilient Cyber Systems (FORCES) considers the resilience of US energy, we tend to think of preventing accidental or malicious intervention, or cyber terrorist attacks. I wondered when FORCES asked me to write this article, if the unfolding story of energy boom and bust would resonate as a threat to energy resilience.
Here are the key players: the oil and gas industry, the banks and wall street, non-OPEC producers, OPEC and Russia, retail and commercial consumers; and here are the indicators which also become drivers: price of oil and gas, inventory, number of rigs, capital expenditures (CAPEX), production levels and changes in millions of barrels per day(mbd), defaults on debt, bankruptcy filings, and layoffs. The list goes on as everyone wanted to enter the arena. Other catalysts include renewable pricing and production, government tax incentives, weather and natural disasters.
Price of OIL: West Texas Intermediate (WTI) in $/Bbl. Source: Bloomberg / MLPFS
In 2008, oil prices had steadily risen to all time highs ($151/bbl). During the financial crisis of 2008- 2009 oil retrenched from $125/bbl to $42/bbl. From 2011-2014, oil prices largely traded in a range between $95 and $105. In January of 2014, many factors had contributed to a severe supply overhang. While the US reduced production by 1.08mbd to lessen the supply/demand (S/D) imbalance, OPEC and Russia sometimes met the demand with their cheaper production. U.S. fracking, horizontal drilling and technological innovations led to significantly increased production. In addition, the 2015/16 El Nino created the warmest winter in years reducing heating energy demand. This growing S/D imbalance precipitated the quick fall of oil prices.
By February of 2016, natural gas fell to $1.66/MMbtu, its lowest level since the bust of 1999. However, in a sudden reversal, excessive temperatures increased demand, and a massive fire during May and June in Canadian oil fields lost 1.1mbd of production. Together these caused a drop in peaked inventories, ushering in a strong summer rally, with natural gas prices rising +83% (from $1.66 to $3.05/MMbtu). Hello, volatility.
Companies have become cautious about reacting to good news. Price volatility, waffling Federal Reserve statements and unknown election results have added to uncertainty. Most companies are not planning to add rigs, and most are cutting capital expenditures (CAPEX), (i.e., -25% worldwide, but US CAPEX has seen 40% to 50% cuts.) The production decline was fast but restoring it is slow; companies are waiting until they believe there is sustainable improvement.
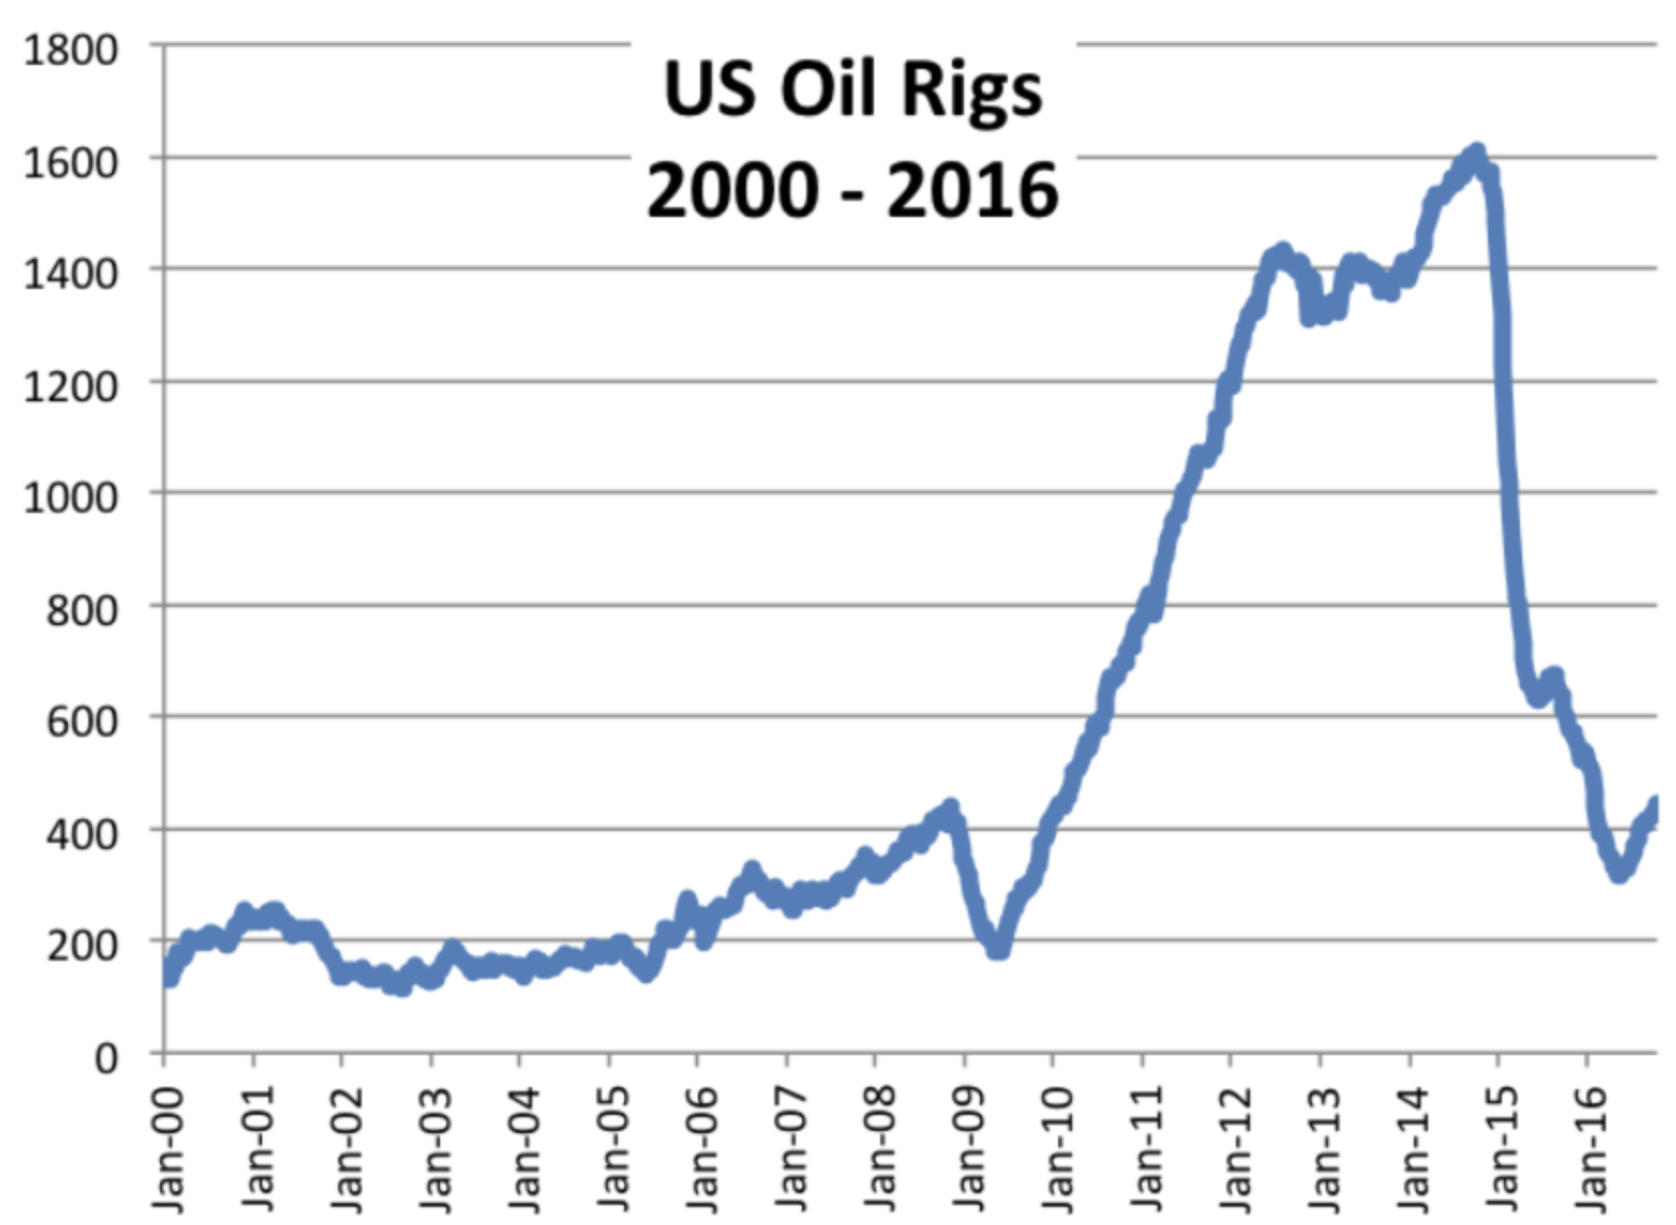
Rigs: In May 2016, US rigs hit their low of 316. At that time, in preparation for the Houston annual Offshore Technology Conference (OTC), Baker Hughes reported that while US Rigs were down, Middle East rigs had increased 5%. As of October 20, 2016, the US has 443 oil rigs, compared with 600 a year ago, and a peak of 1600 oil rigs in Sept of 2014.
Last week at the OPEC meeting in Algiers, OPEC announced an agreement in concept to reduce production for the first time in eight years. This news led to swift increases in oil of +3.2% to $45.93 and by Friday oil was up 8% to $48.24/bbl for West Texas Intermediate (WTI). However, OPEC put off until next month the difficult part of determining how much each country must reduce its output. The imbalance is effecting every part of the energy supply chain: exploration, operations, pipelines, shipping companies, refineries, etc. ...with lower prices, lower cash flow, lower capital expenditures, and lower oil and gas production. Even before companies lowered production, their cash flow was suffering from reduced prices. Then, their efforts to rebalance the S/D via production decreases further exacerbated negative cash flow. In June 2008 at the height of the market with WTI oil prices at $151, credit was easy, it was still easy in June 2014, with WTI at $105. Often smaller firms used bank “reserve-based lending” However, with depressed oil and gas prices, the reserves lost value, ratios sank and threatened to not meet debt covenants, banks began calling in debt and new loans became scarce.
In addition to banks tightening credit, bond and equity market funding also dried up. For example, during early 2015, monthly energy debt issuance was $6.5B. By August of 2016, monthly issuance was down 75% to $1.7B.

The US Energy Information Administration (EIA) recently reported that on average, 83% of energy cash flow is being used to service company-debt. Balance sheet strengthening has become a necessary, high priority. Furthermore FuelFix reported that 135 companies are on the verge of bankruptcy. These are in addition to the 175 companies that already filed for bankruptcy. Other firms are being merged or sold. McGrath reports that in 2016, more than 140 companies in the oil and gas industry have defaulted on debt, most of which was issued in 2013 and 2015, and most of which was not rated.
Merrill Lynch reported the outlook from oil and gas companies: The highest priority use of cash flow for most companies is 1- debt service (i.e., paying interest on their enormous debt load), and 2- strengthening the balance sheet, by either paying down debt principal or selling assets or both.
Companies were asked about price levels for various stages of recovery: sustainability, adding to rigs, adding CAPEX, and growth. Responses were mixed, but it is believed by some analysts that it would cost $25 from every barrel of oil produced by the US to have enough cash flow to pay for 425 more rigs. Consequently, oil would have to be $25 higher than today in order to support this without negative cash flow. So, $50/bbl would barely be sustaining; $70-$75/bbl would provide money for rigs, growth would be at $80/bbl.
Renewables: Renewables are cheaper to create than ever before, adding to the glut. The Houston Chronical reports the Department of Energy saying there is a cost improvement of 41% and 54%, for onshore wind turbines and rooftop solar panels, respectively. Last year, renewable energy accounted for 66% of the power generation installed in the US. In 2000, there was effectively none. Energy Secretary Moniz recently spoke to Congress reiterating the importance of low-carbon energy production, yet foreshadowed 2020 phase-out of renewable energy tax subsidies. Additionally consumers are using more energy efficient lighting (LED), efficient buildings are being created to an LED5 standard , and companies are improving electric car efficiencies. While these lower demand, there is a surge of large gas guzzling vehicles because gas prices are down.
Nuclear: The low-cost, surging production of renewables is creating doubt for the need of government financial subsidies for nuclear energy. Yet, nuclear is efficient, clean, unaffected by weather, and runs approximately 24/7. Yes, the recent Japanese Nuclear disaster raises anxiety over possible future problems, though the safety of our nuclear energy has not been tainted. Yes, nuclear energy is expensive, but FERC is revisiting rate-making policy and cost allocations. Additionally, newer nuclear reactors cost half as much as older ones to operate. Lastly, the labor market for nuclear is aging and will soon retire.
Nuclear currently comprises over 60% of clean non-carbon-emitting fuel. We cannot afford to eliminate our key “green" energy source. We have approximately 100 reactors, but 5 were recently retired and several more have accelerated their retirement. In the U.S. some states are subsidizing their nuclear power plants, while others are prematurely decommissioning / retiring them. These reactors were expensive to build during times of energy shortages; we were investing in nuclear power. While reactors are now comparatively expensive to run, this author worries that hasty decommissioning decisions during cheap energy years will be costly mistakes in the long and even medium term.
In summary, the energy bust is in its second year. The supply overhang continues to depress prices. Macro-events are adding uncertainty. Funding sources are extremely limited in an industry that has been overbuilt, oversubscribed, and loosely monitored by lenders. Cash flow is going almost entirely to debt service. Rigs and CAPEX are down, and the entire supply chain is being impacted. Companies are defaulting and many are going bankrupt. The solution is not likely to be quick, but hopefully we are on the right track for recovery.
Sometimes, the biggest risk is right in front of you.